“Invest in high-risk assets to get high returns” is a commonly-held, oft-repeated belief among investors, finance professionals and market experts.
The idea flows from the modern portfolio theory, which states that when investors invest in asset classes whose outcomes or price movements are known to remain highly uncertain (as opposed to an investment such as a government bond where you are virtually guaranteed a fixed-percentage return), they expect the asset class to adequately compensate for the additional risk.
However, the above statement carries an inherent catch that many investors and often experts fail to appreciate: when an investor invests in a risky asset class expecting higher returns, he is also taking the risk of getting lower returns compared to the risk-free or lower-risk investment over a given time period!
That is, far too many investors somehow fail to realise that if they are willing to forego the fixed 8% yield of a fixed deposit or a similar debt/liquid instrument in a bid to earn the 15%-18% that Indian stocks have yielded historically and are generally expected to deliver in the future, they also face the risk their stock returns could be far less than the safe 8% during their particular investment horizon--or zero or even negative. Precisely the predicament many Indians who invested heavily in stocks or stock funds in late 2007 find themselves in today.

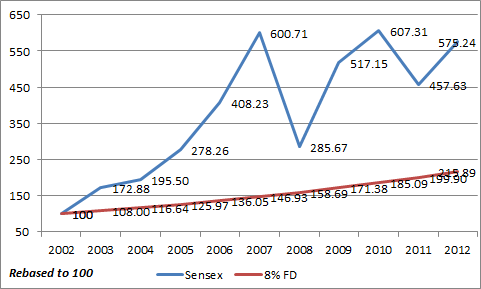
Let's illustrate with an example: the above chart maps the performance of the Sensex (rebased to 100) between December 31, 2002 and December 31, 2012, compared to a hypothetical FD yielding 8% compounding returns.
So if you had invested Rs 100 in the Sensex at the start of 2003 and had a five-year investment horizon, your investment would have grown to Rs 600 (compounded annual growth rate of 43.13%) at the end of 2007, compared to only Rs 147 for the FD (the risk worked in your favour).
But if you had a similar five-year investment horizon starting in 2008 instead, the risk worked against you and your stock returns at the end of 2012 were a poor -0.86% annualised.
If you had a 10-year horizon starting 2003, you would have been better off investing in the Sensex (CAGR of 19.12%) rather than the fixed deposit.
Stocks outperform in long run: But how long is long?
While there are often various periods where stocks underperform safer or lower-risk instruments such as bonds or fixed deposits, they are known to outperform the latter over the long term (the reason financial planners advise investing in stocks and stock funds only if the investor has a “sufficiently long” horizon).
But this statement can also be highly misunderstood. That is because agreeing on the investment horizon is a tricky issue. Some advisors say the minimum investing horizon in stocks should be at least three years, the more conservative ones insist on five years, while after the performance of the past five years, some suggest it should be seven.
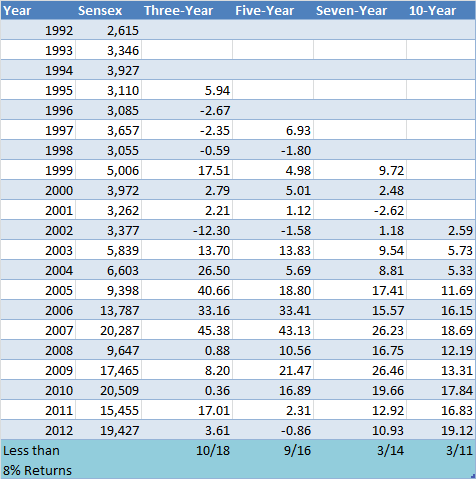
If we look up data from the past 20 years using rolling three-, five-, seven- and 10-year windows, we see that stocks (measured by the Sensex) failed to compensate for the additional risk they carry and underperformed the safer 8% return provided by liquid instruments such as fixed deposits on many occasions (the 8% figure being a rough average that FDs have yielded over the same timeframe).

In fact, as shown in the table above, stocks underperformed the hypothetical 8% FD as many as 10 times out of 18 occasions over three-year windows, nine times of out 16 over five-year periods and three times each over seven- and 10-year timeframes.
Which means, if past data is anything to go by, there is more than a 50% chance stocks could yield less than fixed-income instruments if investment horizon is less than three or even five years (we won’t get into what happens if your stock returns beat the market, which your stock portfolio or an active fund could do).
In fact, a study that looked up 140 years of U.S. data suggested that though stocks have, after inflation, risen 6.5% since 1871 (more than the 3% or so for bonds), since investors' realistic horizons are shorter, a rather disconcerting fact was that there were at least three 20-year periods where returns were zero!
So if we consider risk as volatility that results in stocks underperforming risk-free or lower-risk asset classes over a desired investment horizon, investors should ensure the window is as long as possible (how about Warren Buffett’s favourite holding period: forever?)
But the problem doesn’t stop there: there are pitfalls of also equating risk as being equal to volatility.
Does risk equal volatility?
There are two reasons why risk cannot be always equal to volatility.
Not all risk is similar: Traditional risk measures such as standard deviation focus on both upside and downside variance. Investors, however, do not mind upside volatility, it’s downside volatility that hurts.
Which is why, Morningstar’s proprietary risk measures always provide greater weightage to downside volatility compared to upside volatility, and our star ratings for funds incorporate the same Morningstar Risk-Adjusted Return metric.
As an example, while people in financial markets often wonder about Indians’ obsession with real-estate investing, records suggest property has, on average, delivered about the same 18% annualised returns as stocks have but downside volatility has been far less (property prices generally did not fall as much as stocks did in 2008, for instance). Thus, not counting other factors, property has delivered better returns compared to stocks on a downward risk-adjusted return basis (a topic we plan to flesh out in greater detail in another article later).
Past risk is not the same as future risk: This one is the biggest pitfall while equating risk with historical volatility. Most investors do not behave rationally and are subject to various behavioural quirks such as recency bias (the trait of overweighting recent information and expecting the recent trend to continue) or trying to time the market.
Warren Buffett has pointed out that instead of past volatility, risk should be defined as the probability an investor could lose his capital.
So investors left stocks for dead around 2002 when they had underperformed for a long period (instead of buying, as simple mean reversion would have lifted stocks higher) only to pour money into stock funds in late 2007 after years of outperformance, expecting the rally to continue (when reversion to mean would work against them), a point most eloquently made by HDFC AMC’s Prashant Jain in this presentation he published last year.
But stocks, in hindsight, turned out the least risky (from 2003 onwards) when investors thought they carried the highest risk and were the most risky towards the end of 2007 when investors thought they carried little risk.
In fact, in the same presentation, Jain pointed out that past data suggests for every five-year period where stocks have posted dismal returns, the next five-year period invariably is one of strong outperformance. But recent flows data suggests investors have been leaving stocks and stock funds in hordes after five years of underperformance when now could perhaps be the time for turnaround.
Buffett's reasoning about why past volatility should not be a measure of future risk is: fundamentals of investments in relation to their intrinsic values keep changing (and thus their future risk) and, in his last year’s letter to shareholders, advised investors disillusioned with 10 years of dismal U.S. stock returns to stick with the asset class and not flee to bonds as is currently happening.
He warned that at this point and after years of outperformance, the supposed “low-risk” bonds carry a high risk of not even being able to beat inflation in the future while stocks are likely to.
Maybe it is time to relook at how we define risk in the financial markets.